Teamstar Berhad IPO's Analysis
Teamstar Berhad
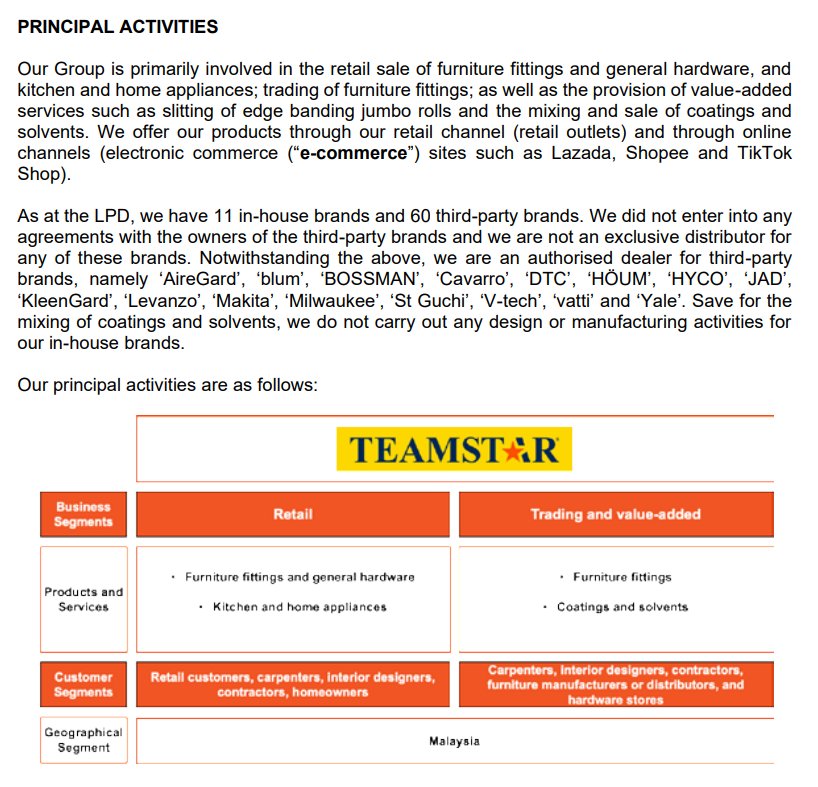
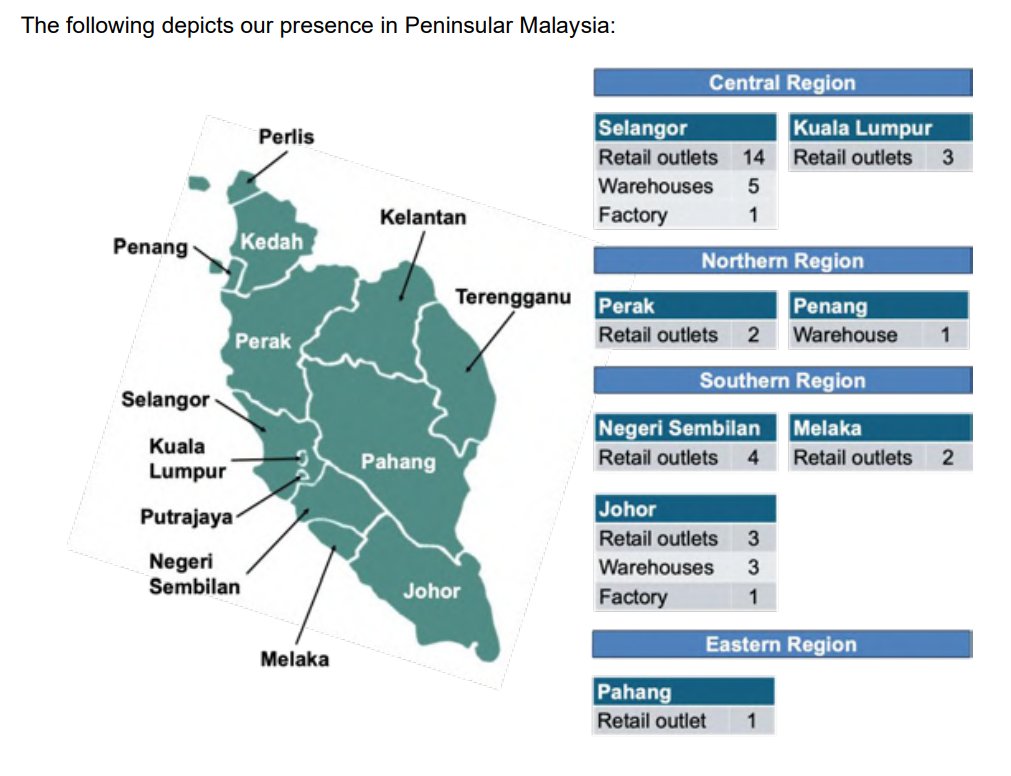
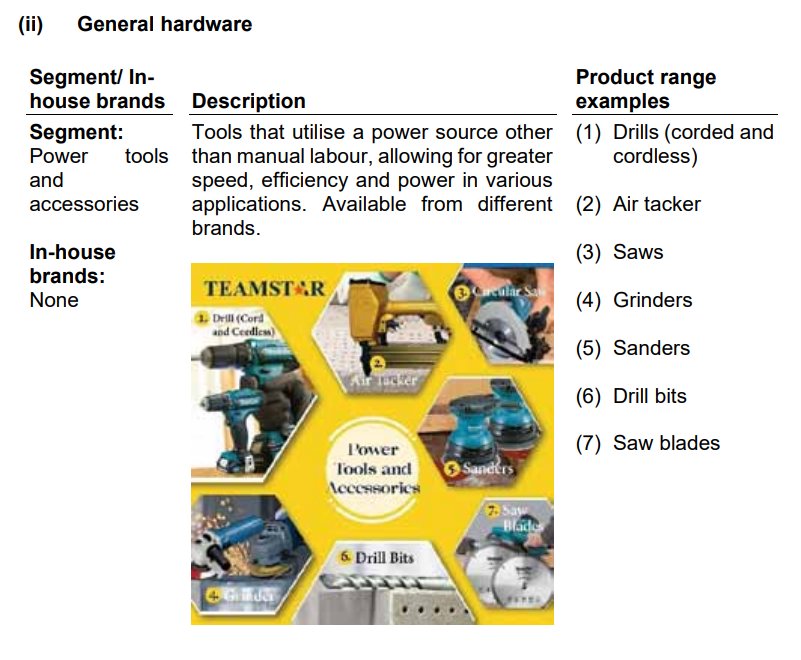
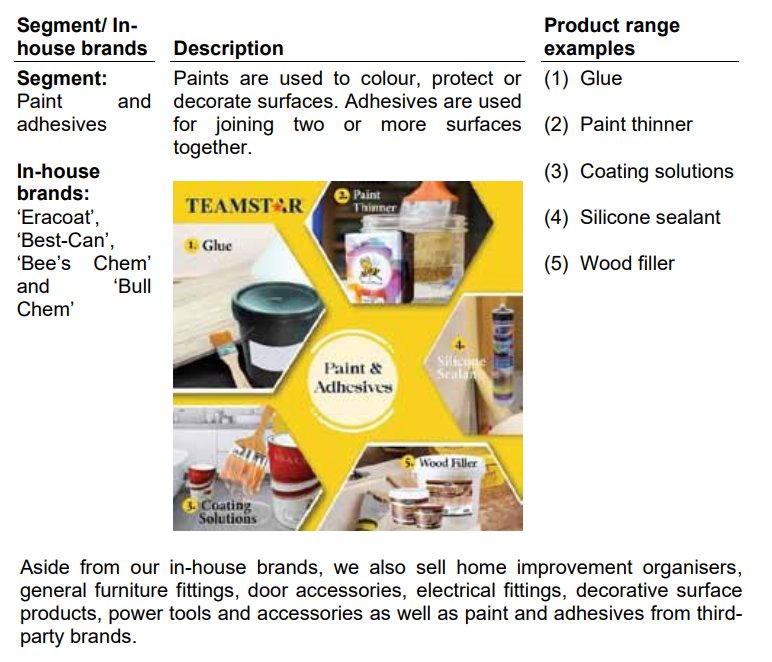
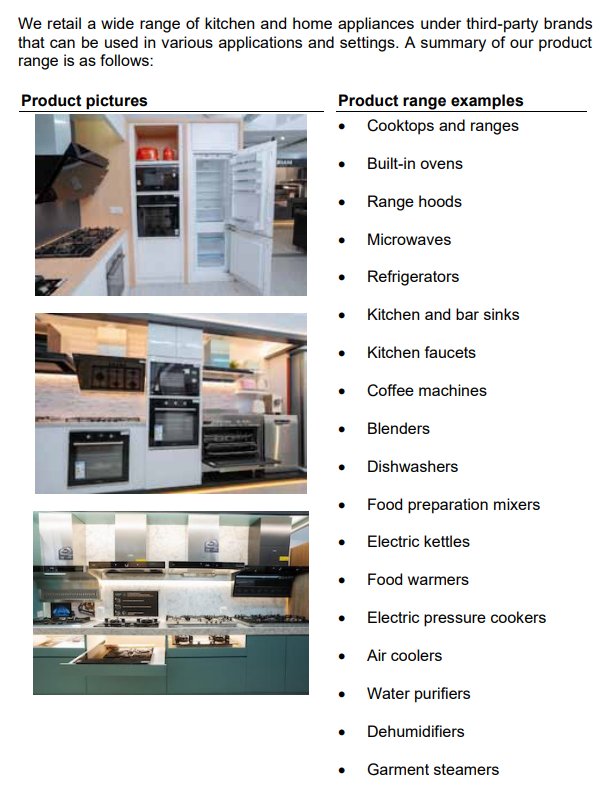
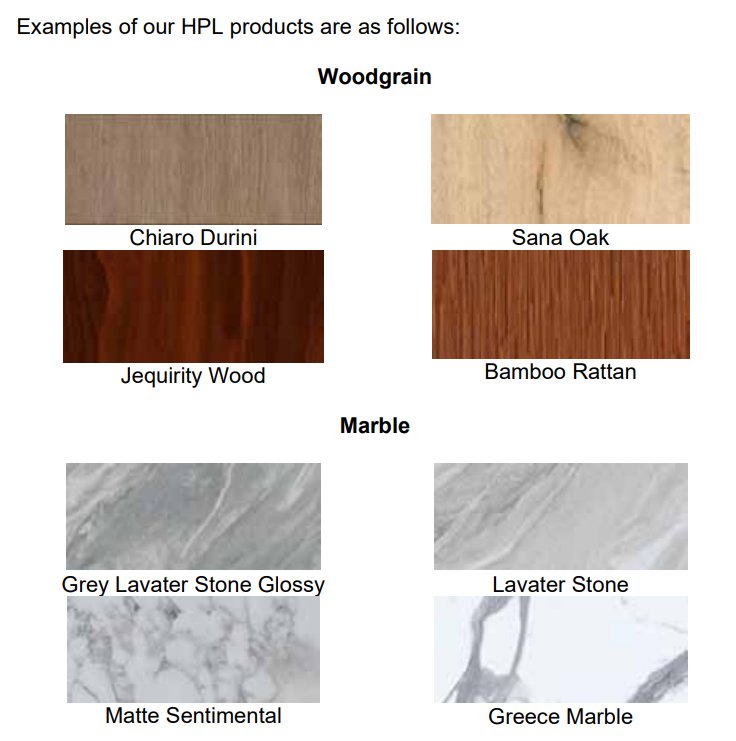
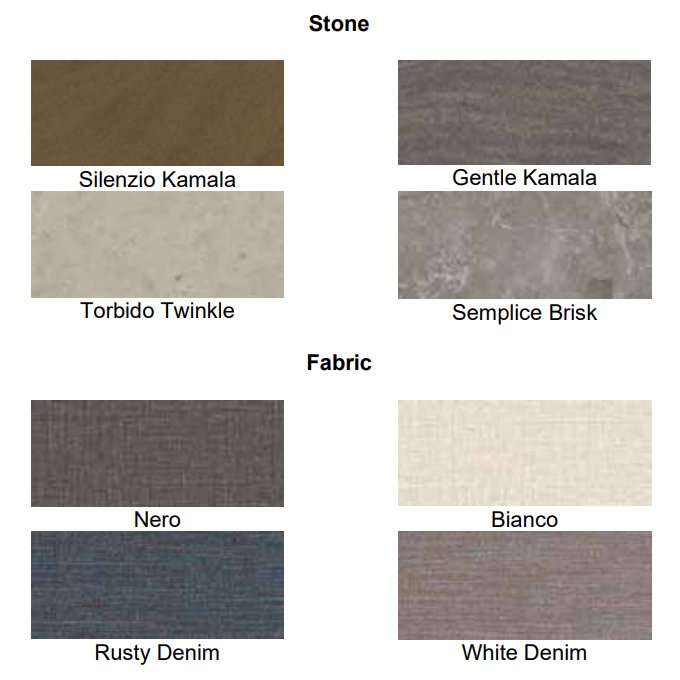
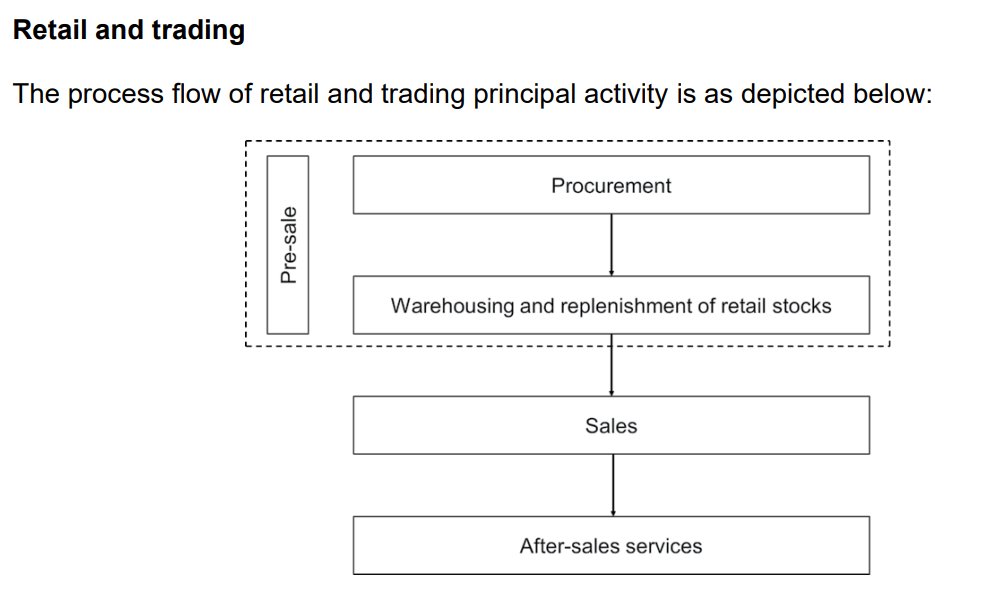
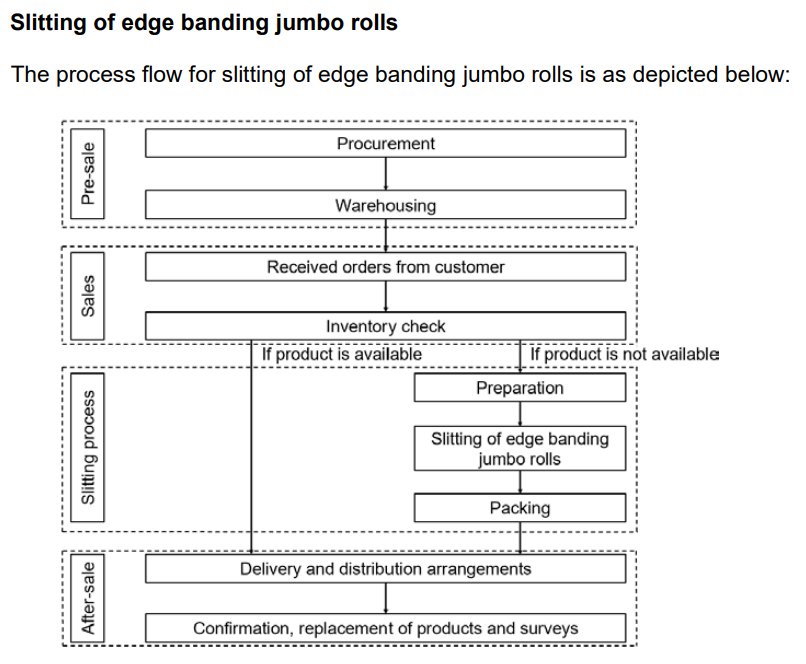
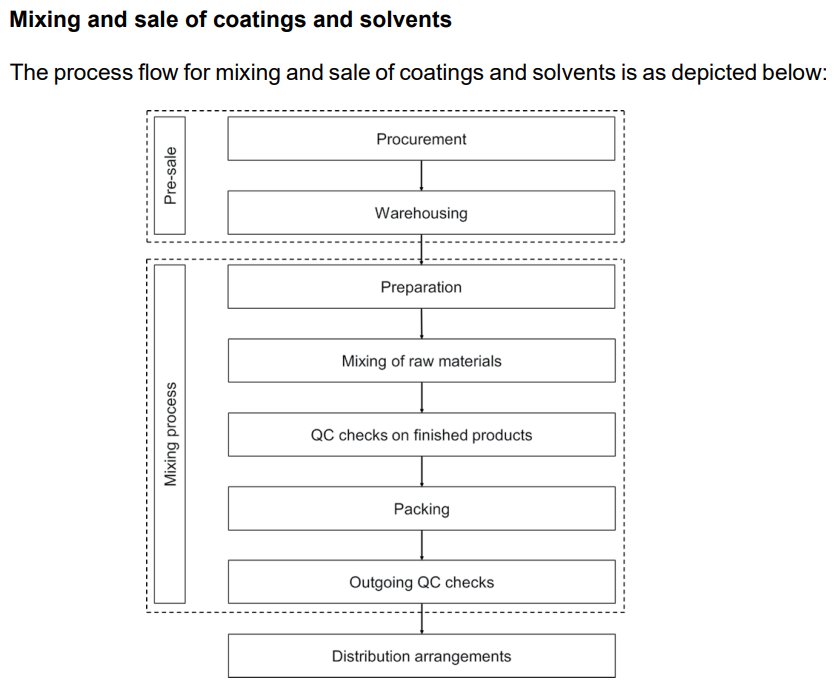
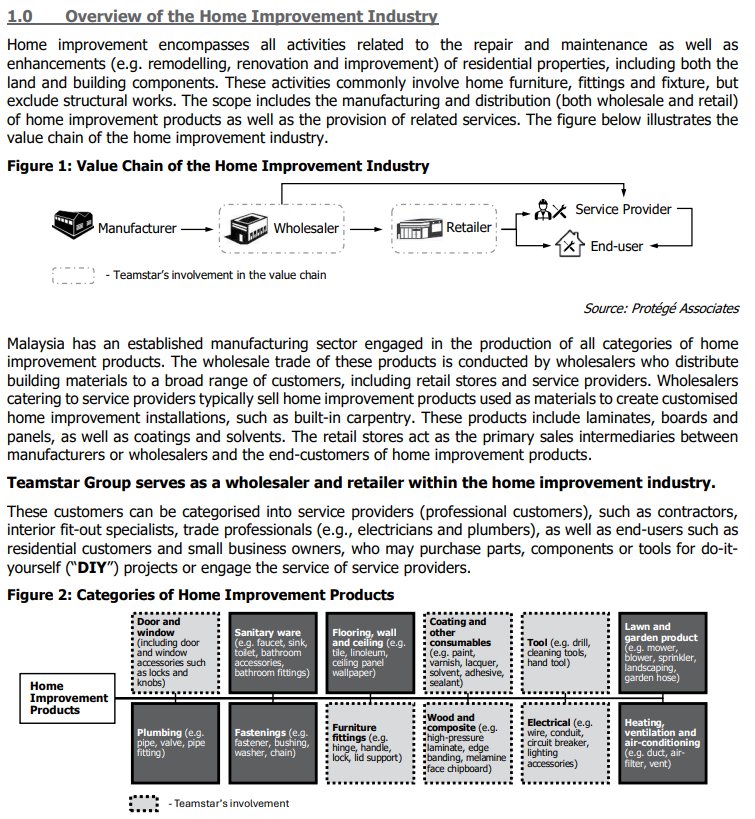
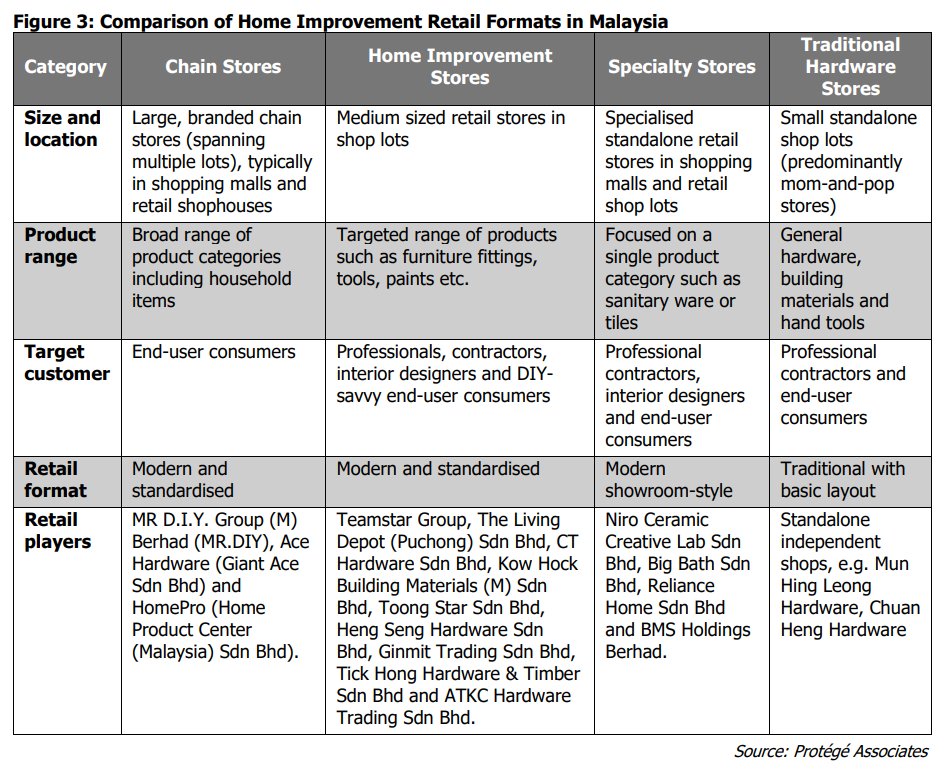
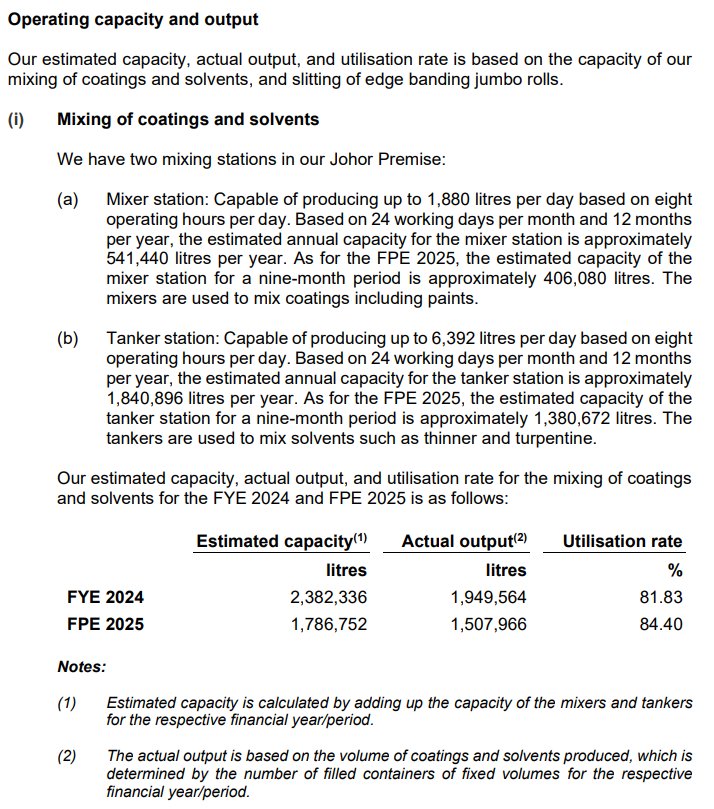
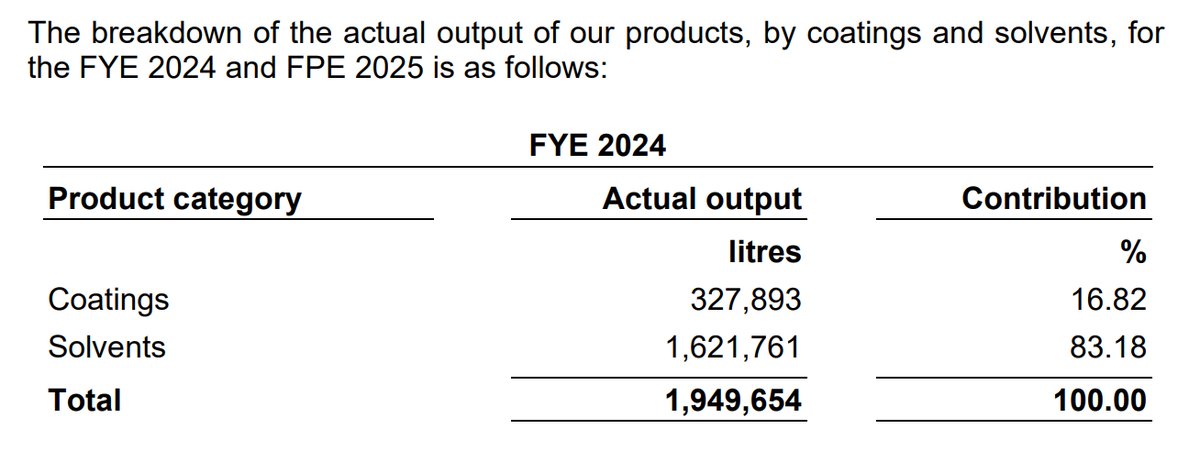
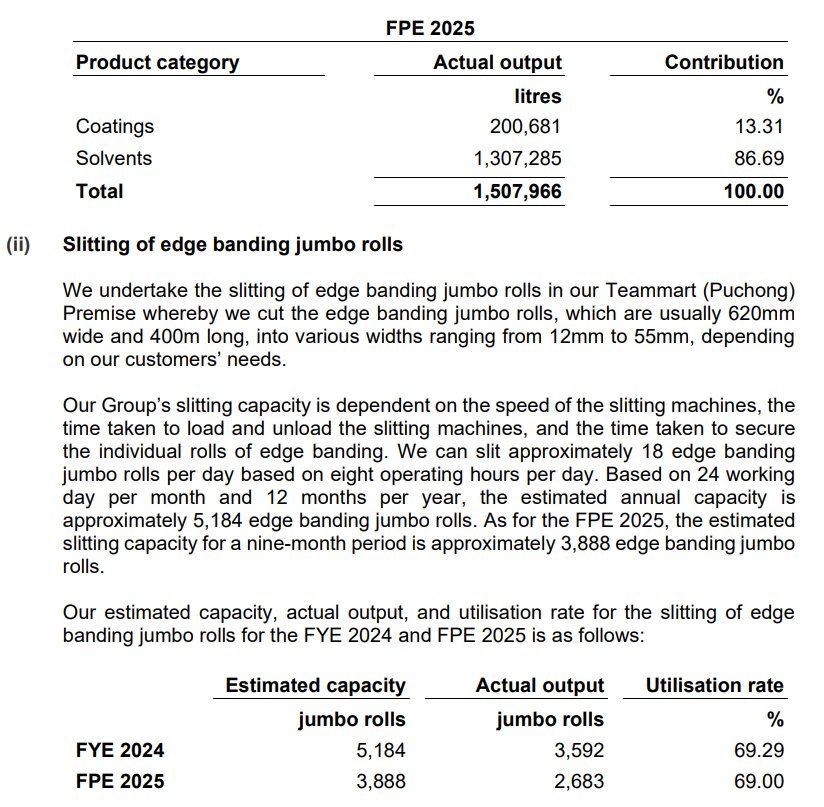
Teamstar Berhad, through its subsidiaries, is principally involved in the home improvement industry in Malaysia. The Group's activities include the retail sale of furniture fittings, general hardware, kitchen and home appliances; the trading of furniture fittings; and providing value-added services such as slitting of edge banding, and the mixing and sale of coatings and solvents. Operating since 1996, the Group has a network of 29 retail outlets across Peninsular Malaysia under the 'Teamstar' and 'Benova' brands. It also sells products under 11 in-house brands and is an authorized dealer for 60 third-party brands. The business is divided into a retail segment and a trading and value-added segment, serving both retail customers and trading customers like furniture manufacturers and contractors.
IPO Details
Strategic Overview & Data Visuals


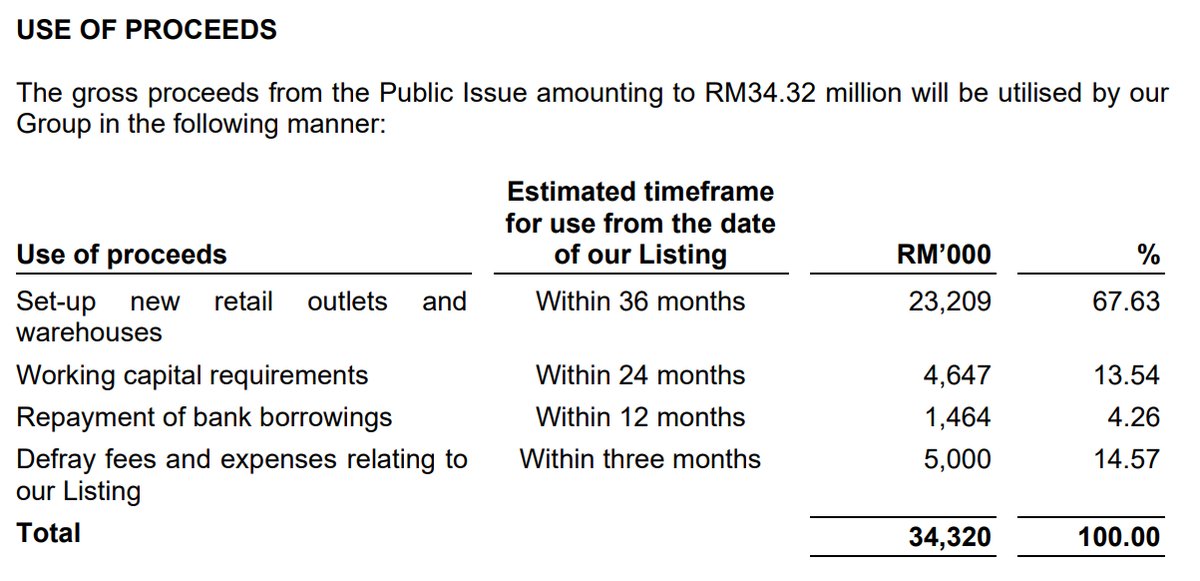
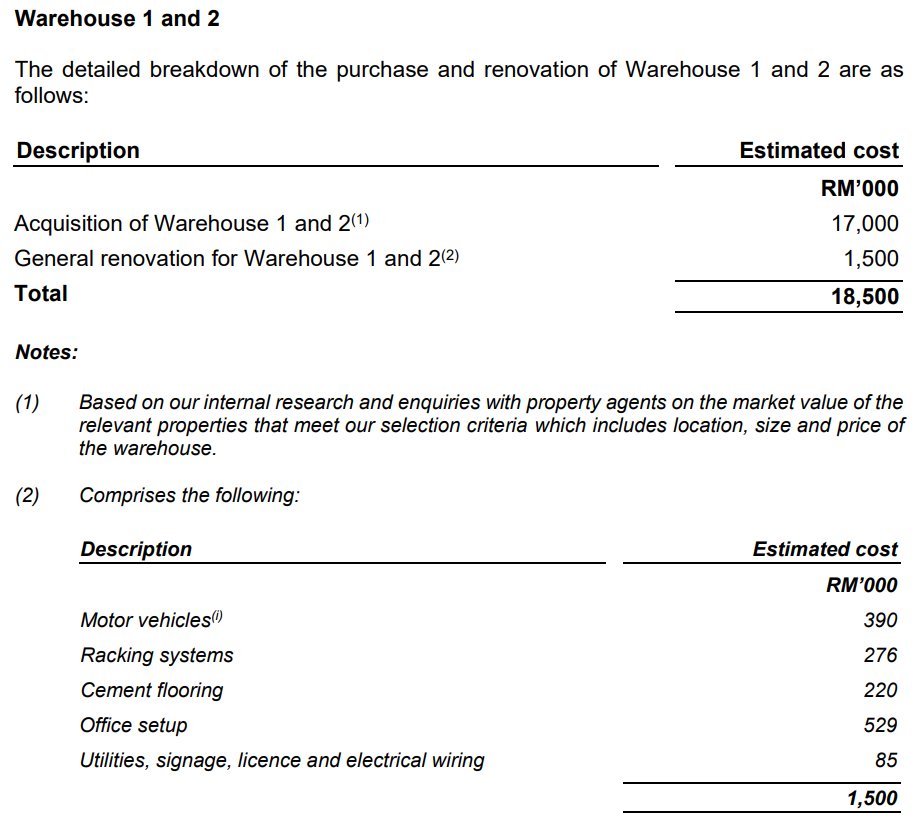
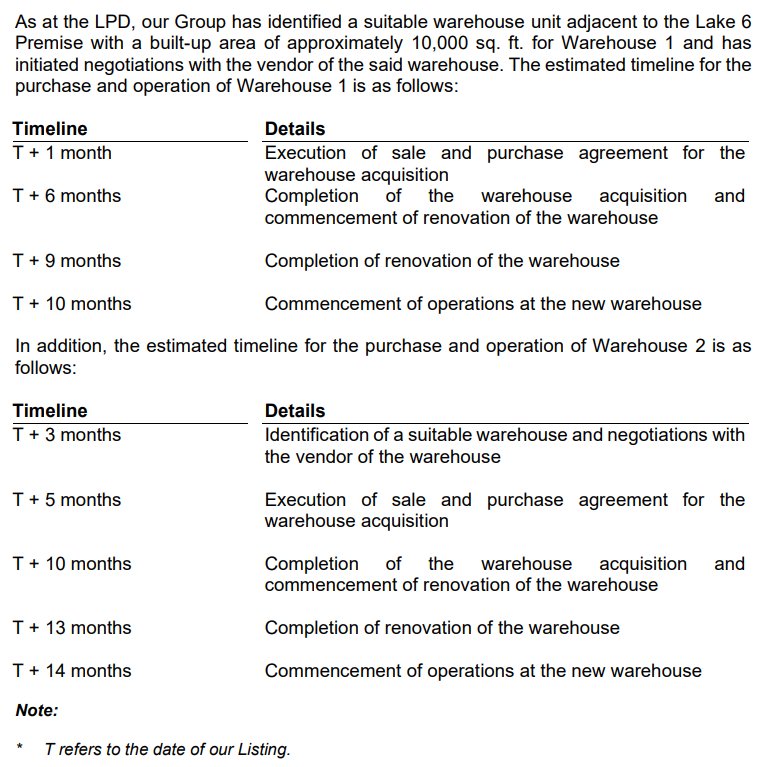
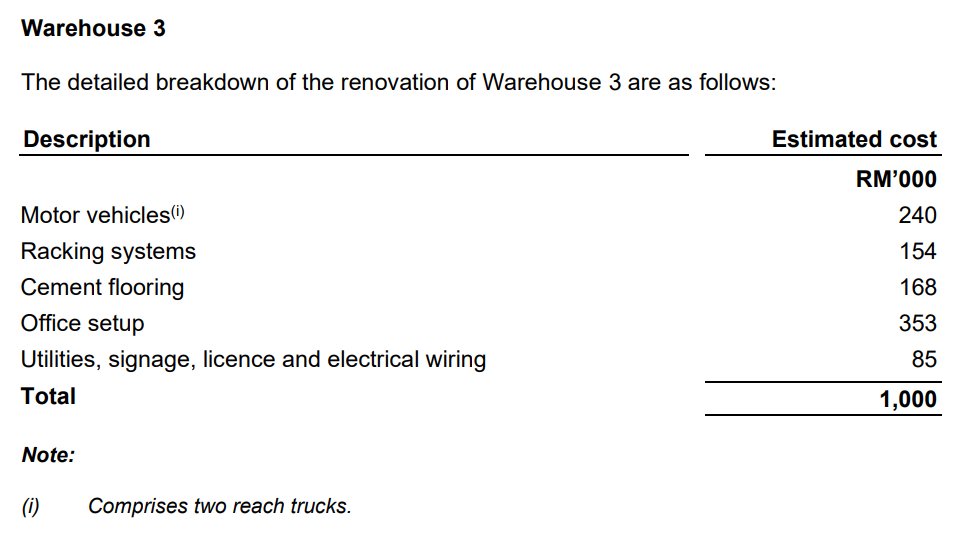
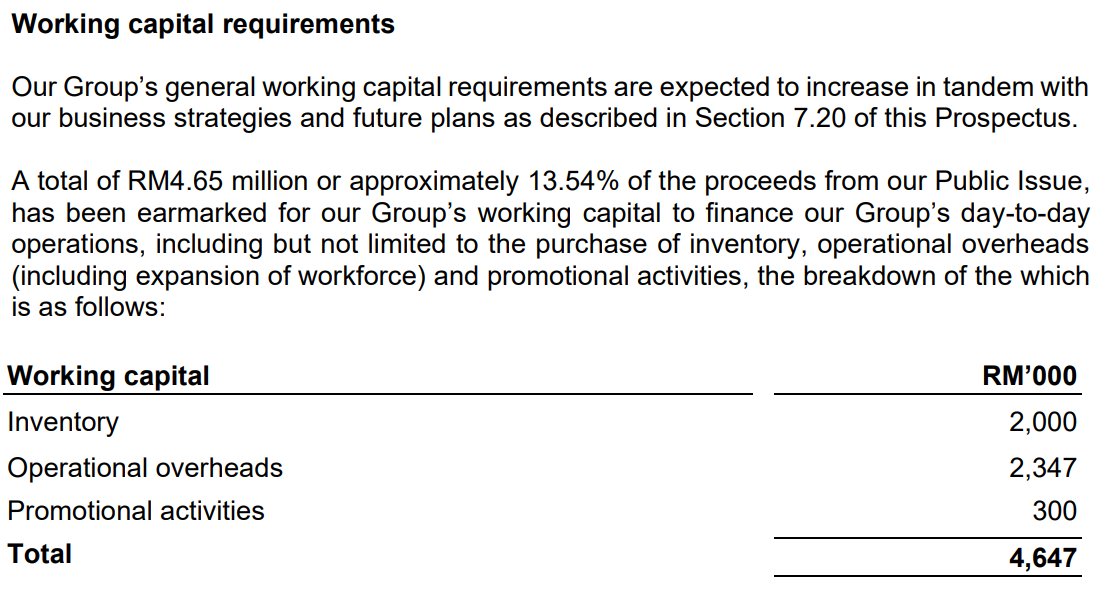
Utilisation of Proceeds
| Purpose | Amount (RM'000) | % | |
|---|---|---|---|
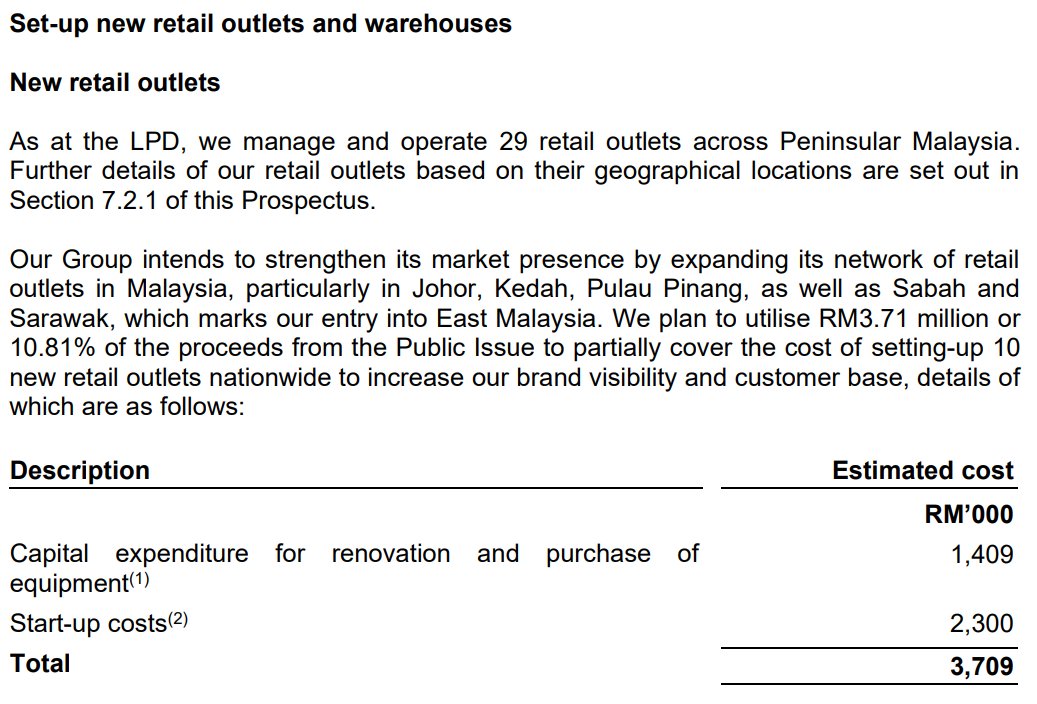
| Expansion | Set-up new retail outlets and warehouses | 23,209 | 67.63 |
| Working capital | Working capital requirements | 4,647 | 13.54 |
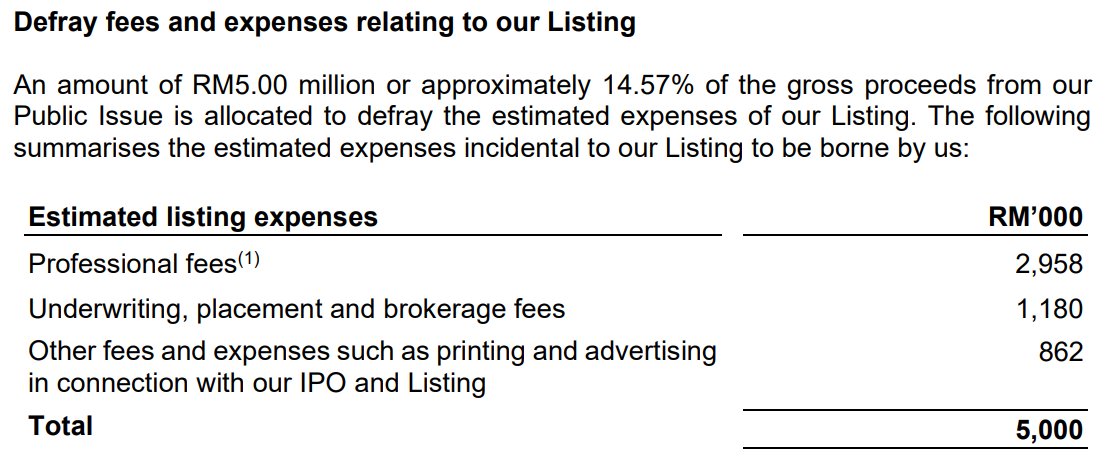
| Listing expenses | Defray fees and expenses relating to our Listing | 5,000 | 14.57 |
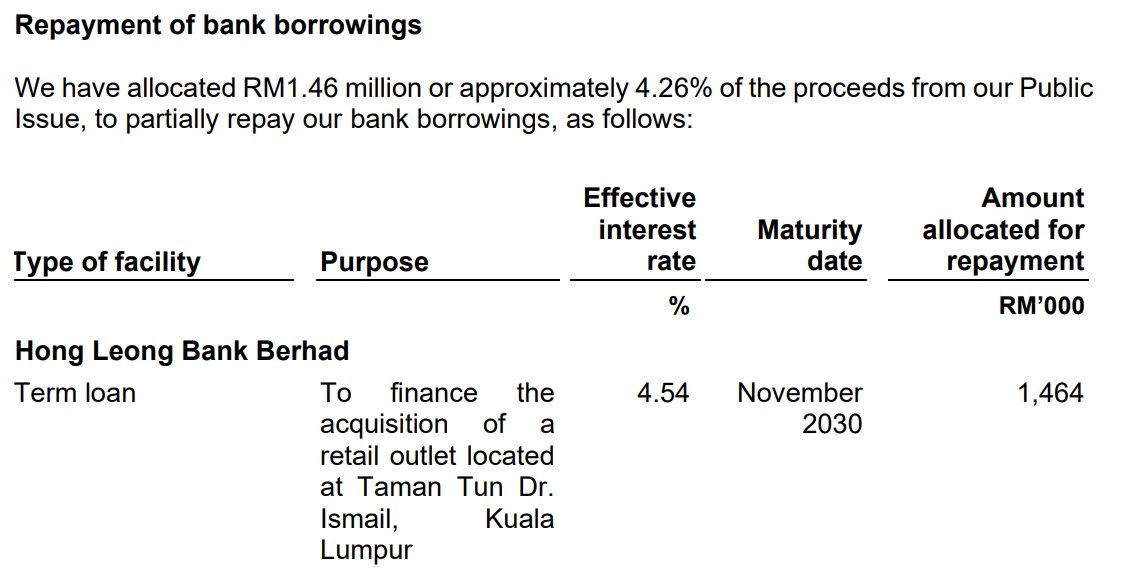
| Debt | Repayment of borrowings | 1,464 | 4.26 |
| Total | 34,320 | 100 | |
Analyst Highlights
| Date | Analyst Highlights |
|---|---|
|
09-Feb-2026
Mercury |
|
|
09-Feb-2026
Mplus |
|
|
04-Feb-2026
Public Invest |
|
Utilisation of Proceeds
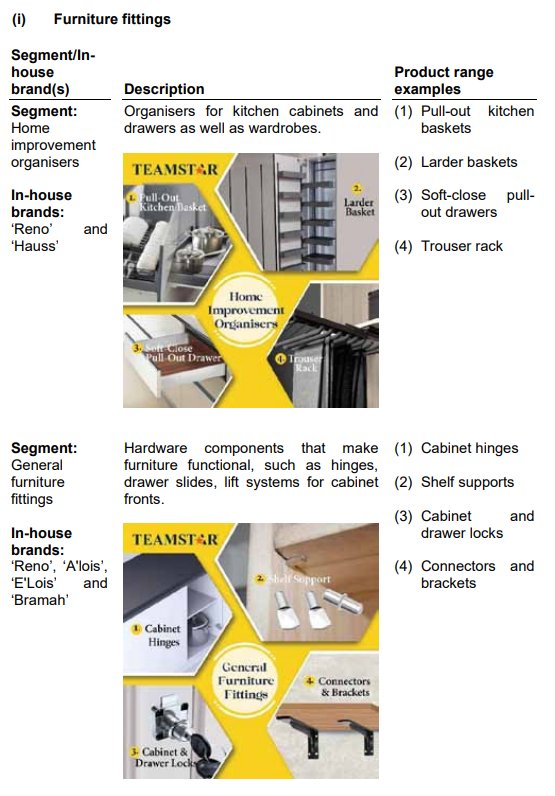
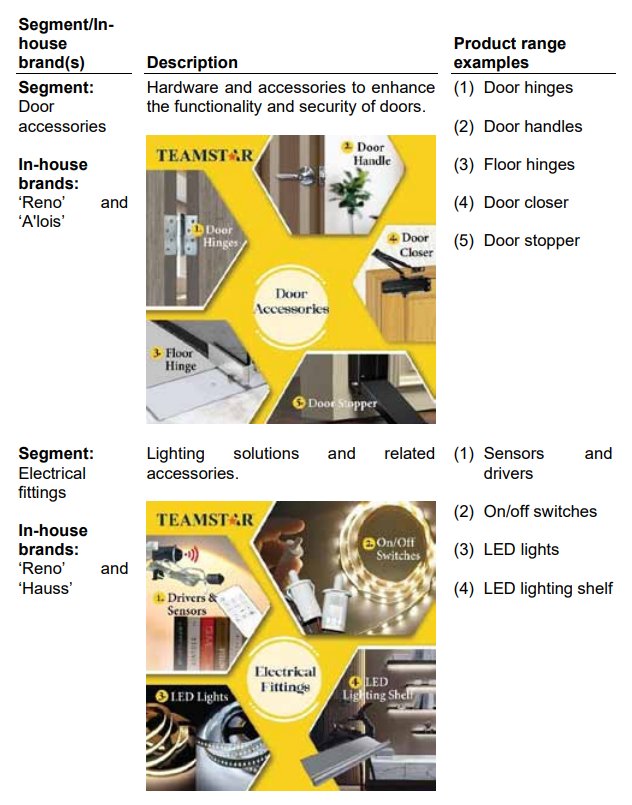
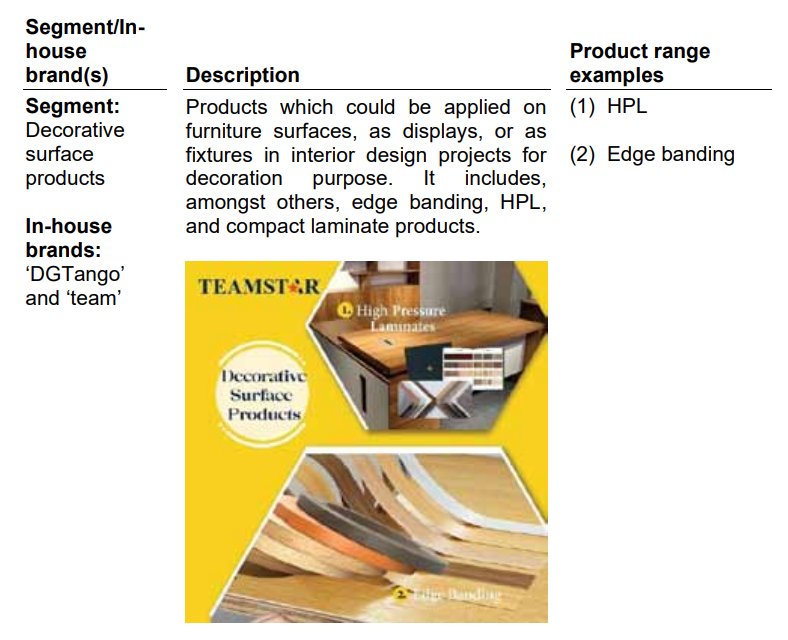
Business Segments
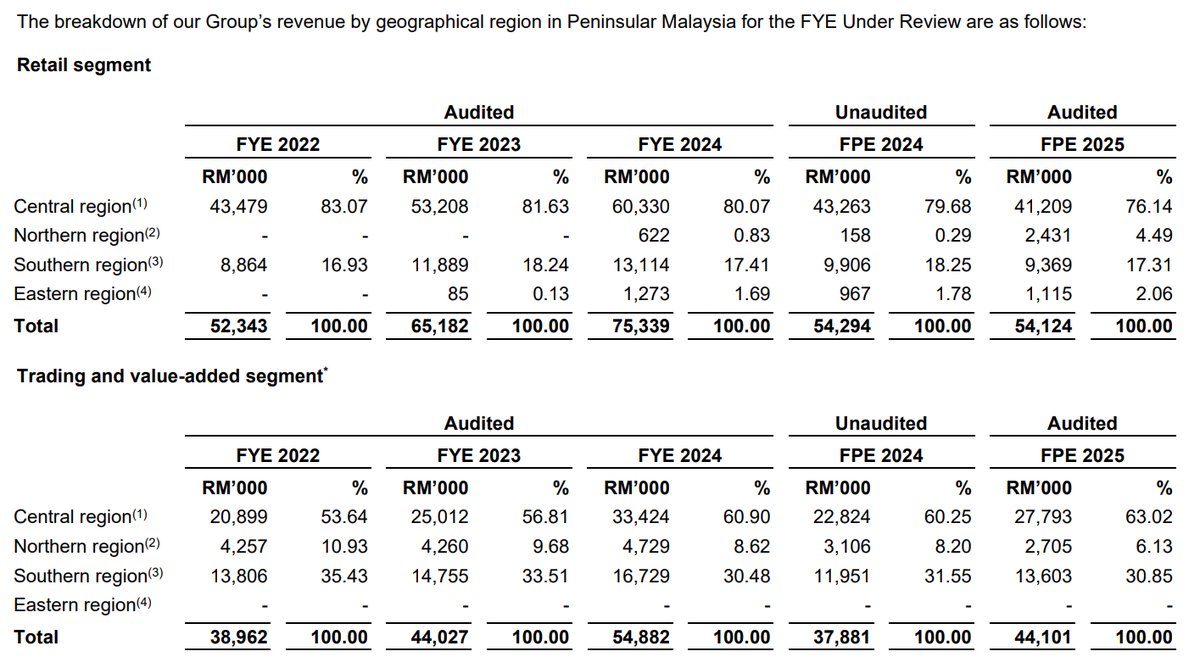
Geographical Segments
Revenue by Financial Year Ended
Profit After Tax (PAT) by Financial Year Ended
Revenue by Financial Period Ended
Profit After Tax (PAT) by Financial Period Ended
SWOT Analysis
Strengths
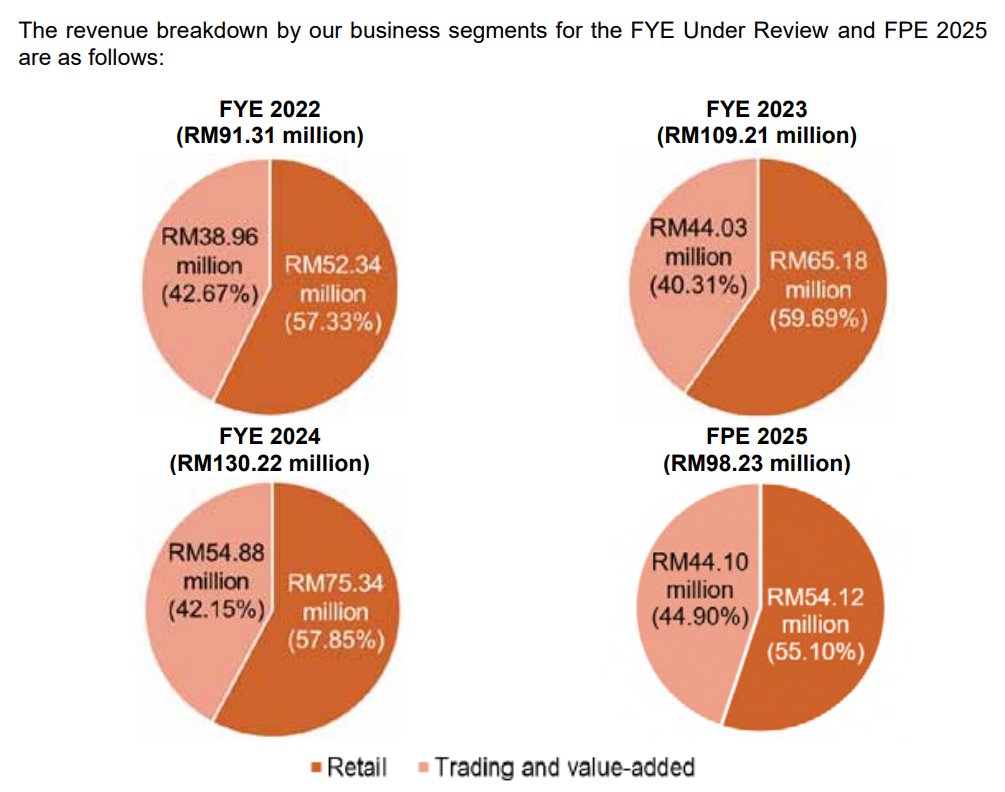
- Hybrid Business Model: The company's dual-channel model, with 57.85% from retail and 42.15% from trading/value-added services, provides revenue diversification and resilience against segment-specific downturns.
- In-House Brand Portfolio: A significant portion of sales comes from its 11 in-house brands, which allows for better margin control and reduces dependency on third-party suppliers.
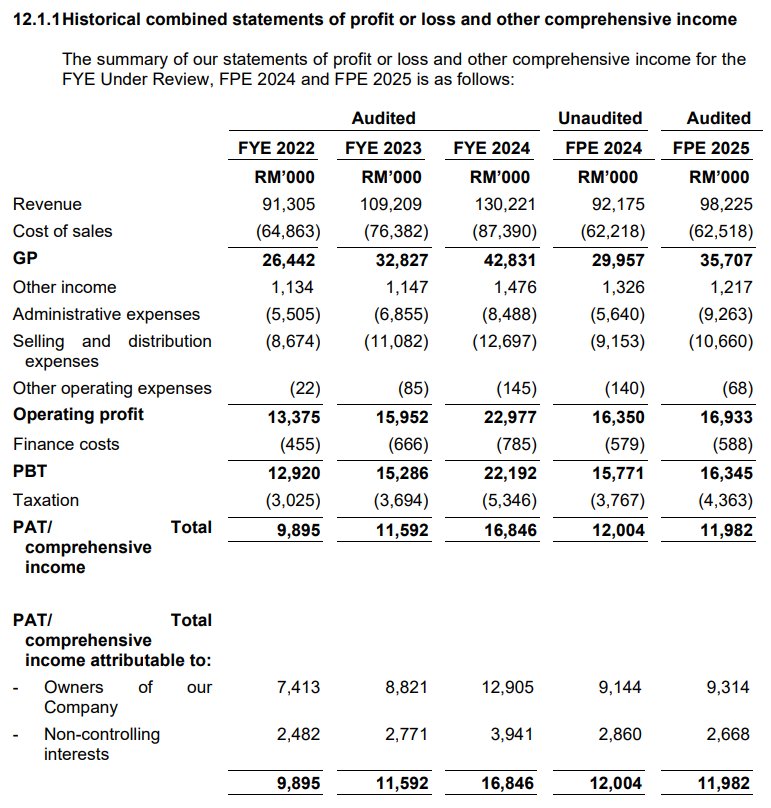
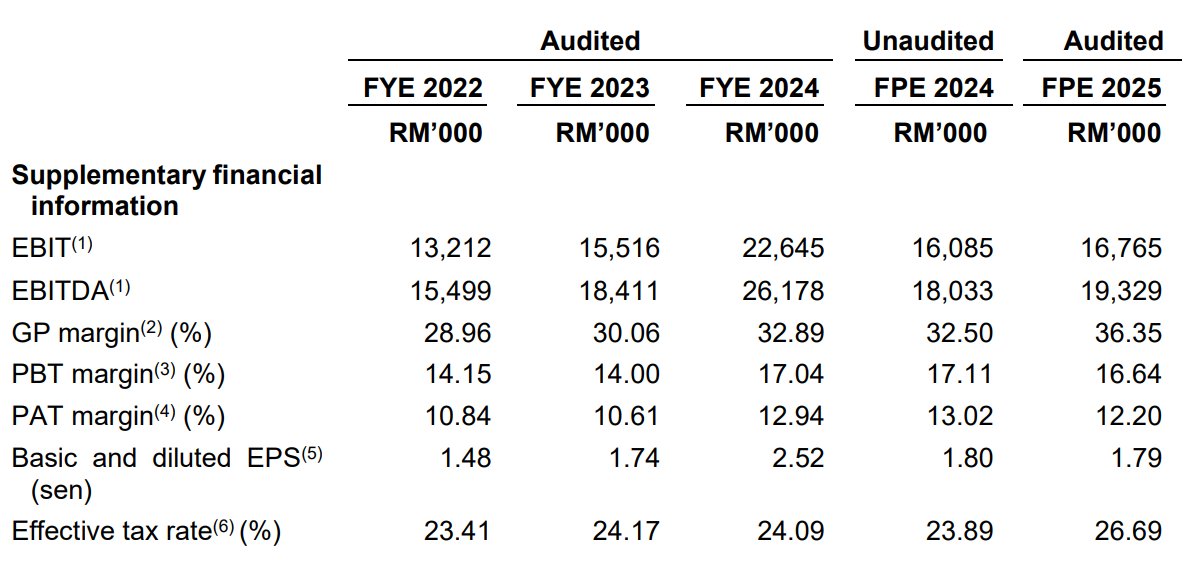
- Strong Financial Growth: The company has demonstrated a strong growth trajectory, with revenue increasing by 42% and Profit After Tax by 70% from FY2022 to FY2024.
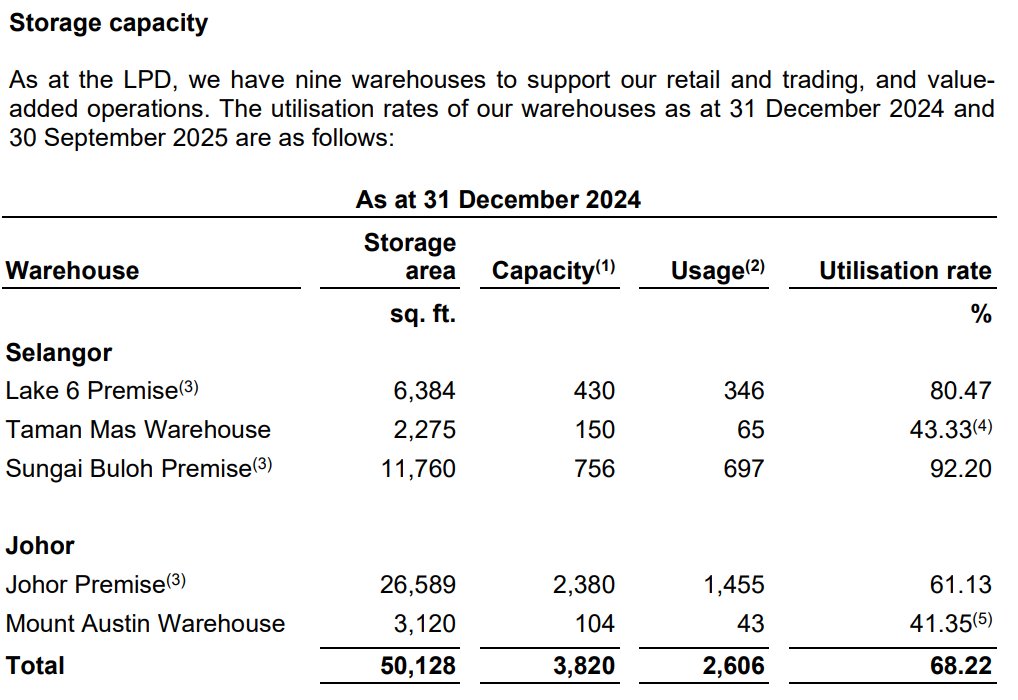
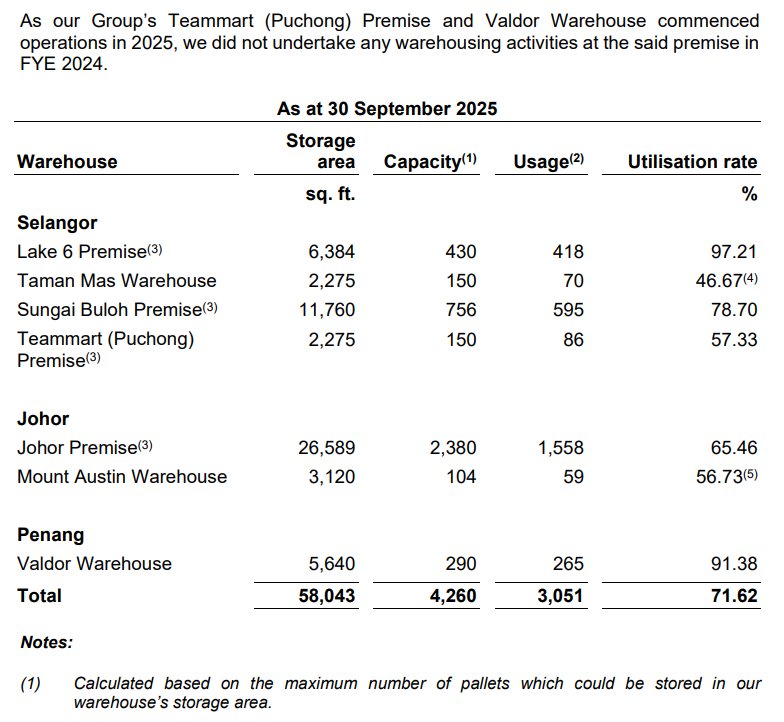
- High Asset Utilization: Existing warehouses are operating at over 80% capacity, which strongly justifies the use of IPO proceeds for expansion and indicates high demand for its products.
Weaknesses
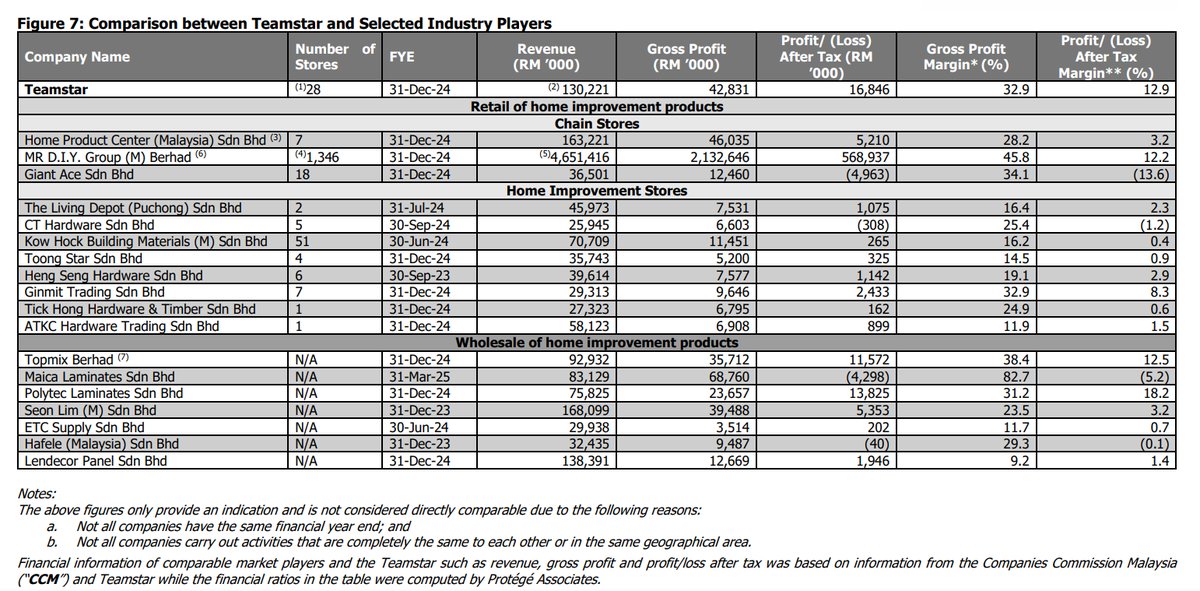
- Low Market Share: With only a 0.3% share in a highly fragmented market, the company has limited pricing power against larger competitors like MR D.I.Y.
- Lack of Orderbook: The business operates on a purchase order basis typical for retail and trading, which provides less long-term earnings visibility compared to companies with multi-year contracts.
Opportunities
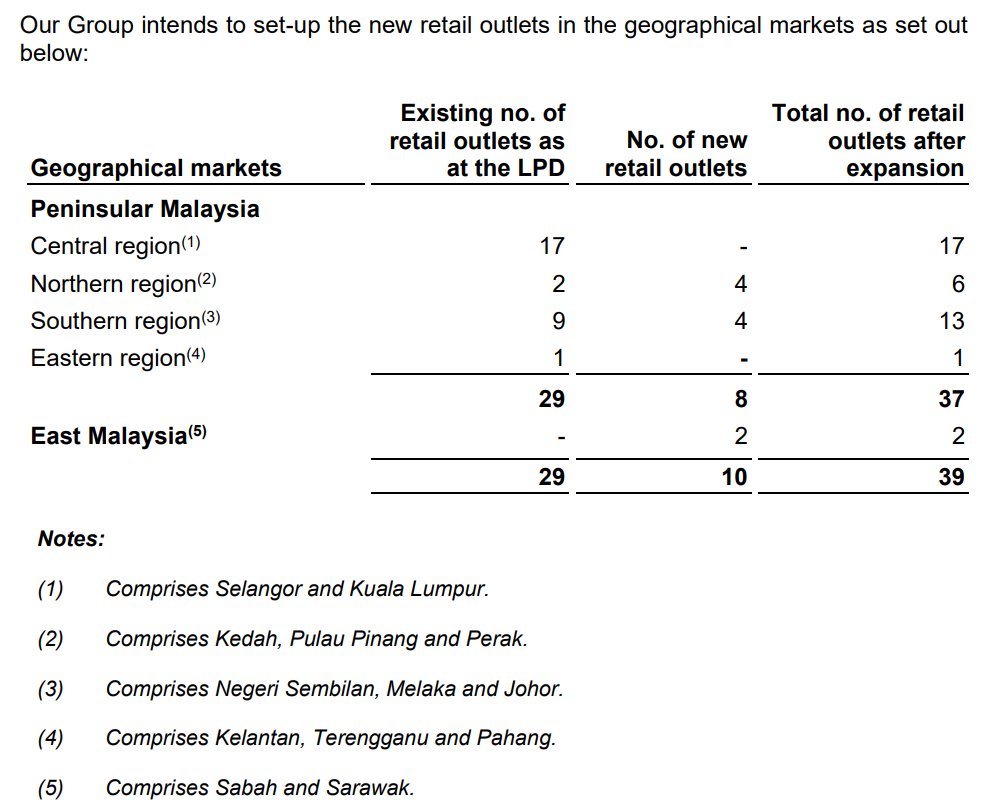
- East Malaysia Expansion: The planned expansion into East Malaysia (Sabah & Sarawak) opens up a new, untapped market for the company's products and services.
- Renovation Market Demand: A strong secondary property market fuels demand for renovations, directly benefiting suppliers of hardware and home improvement fittings like Teamstar.
- Market Consolidation: The company can capture market share from smaller, traditional hardware stores as the fragmented market continues to consolidate towards more organized retail chains.
Threats
- Foreign Exchange Risk: Approximately 27-30% of purchases are in foreign currencies (USD, RMB, SGD), exposing profit margins to adverse movements in the Malaysian Ringgit.
- Intense Competition: The company faces significant competition from large-scale retailers like MR D.I.Y. and specialized distributors such as Topmix, which could pressure market share and pricing.
- Raw Material Volatility: Profitability is susceptible to fluctuations in global prices of key raw materials like plastic, steel, and chemical solvents, which can impact the cost of goods sold.
Key Highlights
Sorry, this feature only available for iSaham Pro
Conclusion
Sorry, this feature only available for iSaham Pro
Teamstar Berhad's Latest News